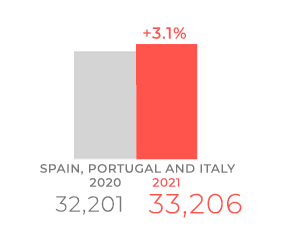
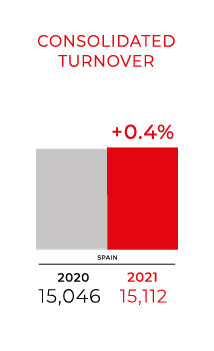
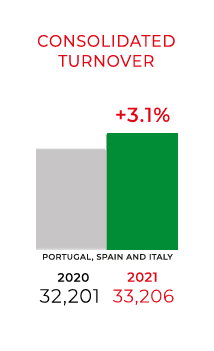
Volume of consolidated Business
In millions of euros, constant associates
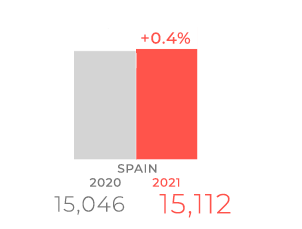
Volume of consolidated Business
In millions of euros, constant associates
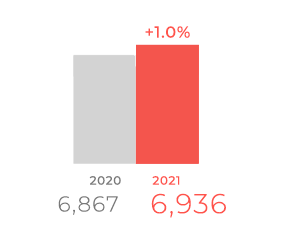
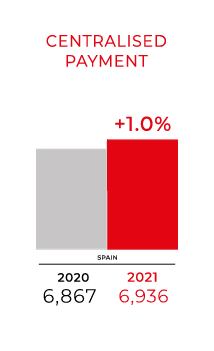
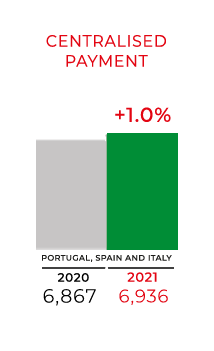
Centralized payments Grupo IFA Retail
In millions of euros, constant associates
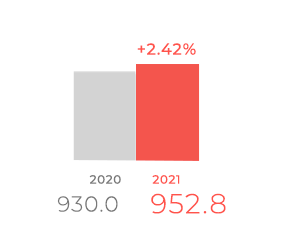
Net turnover Grupo IFA
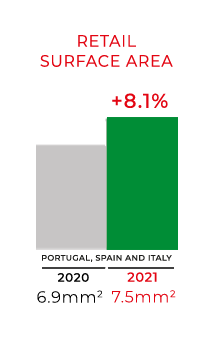
Retail
In millions of euros, constant associates
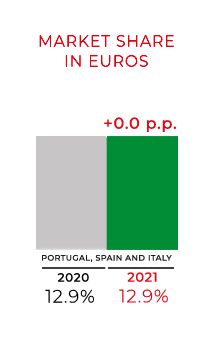
MARKET
SHARE
12.9%
FMCG
(Fast Moving Consumer Goods)
Source: Nielsen
SPAIN, PORTUGAL AND ITALY
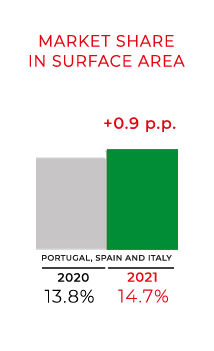
MARKET
SHARE
14.7%
Manufacturers Brands
value participation in
the supermarkets channel
Fuente: Nielsen
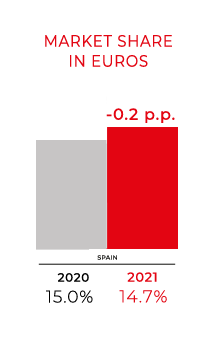
SPAIN
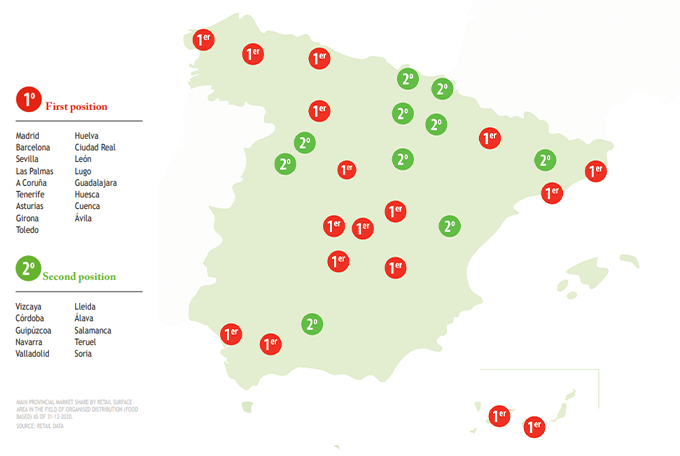
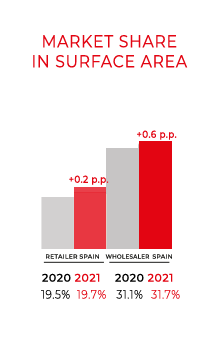
Market share
in surface area
Source: RETAIL DATA
We increased our market share based on value in the supermarkets channel to 19.5% in 2022.
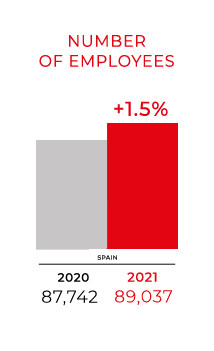
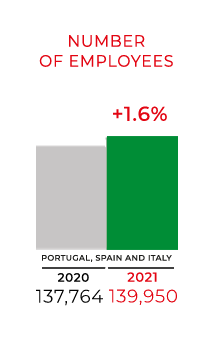
We are one of the country's main employers, creating 1.600 new jobs in 2022, and ending the year with a consolidated base of 90.640 employees.
The market share in the supermarket channel by manufacturer brand – which is one of our distinctive identity features - has raised by 24.2%.
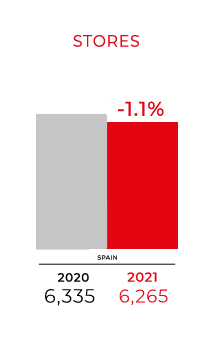
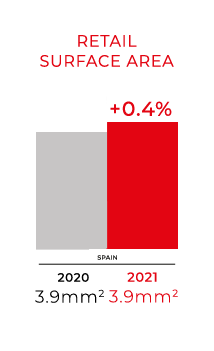
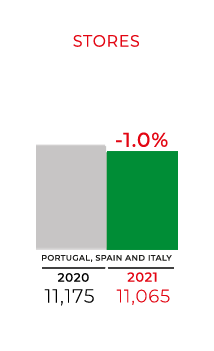
At the year-end date, our national market comprised a network of 6,345 stores over a retail surface area of 4 million square meters.
The consistency of our commercial status is reflected by a consolidated income of €16.627 bn, which involves a 10% year on year growth.
Grupo IFA is the main operator in commercial space in Spain, with a 19.7% share in the retailer channel and 31.2% in the wholesale channel.
The company leads in sales area in 20 provinces and is in second place in 8.
BALANCE SHEET
AT 31 DECEMBER 2022
In thousands of euros

| ASSETS | 2022 | 2021 |
|---|---|---|
| NON CURRENT ASSETS | 3,256 | 3,230 |
| Intangible fixed assets | 458 | 355 |
| Tangible fixed assets | 1,719 | 1,876 |
| Investments in Group companies | 62 | 62 |
| Long-term financial investments | 38 | 41 |
| Tax-deferred assets | 979 | 896 |
| CURRENT ASSETS | 980,426 | 936,467 |
| Inventory | 2 | 28 |
| Trade debtors and other accounts receivable | 980,175 | 902,411 |
| Otros créditos con Administraciones Públicas | 377 | 1 |
| Short-term accruals | 159 | 1,747 |
| Cash and cash equivalents | 90 | 32,281 |
| TOTAL ASSETS | 983,682 | 939,697 |
BALANCE SHEET
AT 31 DECEMBER 2022
In thousands of euros
| NET EQUITY AND LIABILITIES | 2022 | 2021 |
|---|---|---|
| NET EQUITY | 35,914 | 36,540 |
| INTERNAL FUNDS | 35,914 | 36,540 |
| Capital | 1,849 | 1,849 |
| Reserves | 34,959 | 32,958 |
| Group shares | (2,535) | (1,591) |
| Profit | 1,641 | 3,325 |
| NON-CURRENT LIABILITIES | - | 1,250 |
| Long-term debts | - | 100 |
| Long-term accruals | - | 1,150 |
| CURRENT LIABILITIES | 947,768 | 903.157 |
| Short-term provisions | 1,760 | 1,760 |
| Short-term debts | 14,834 | 381 |
| Short-term debt whith Group companies | 50 | 52 |
| Trade creditors and other accounts payable | 930,942 | 899,752 |
| Short-term acruals | 182 | 1,212 |
| TOTAL NET EQUITY AND LIABILITIES | 983,682 | 939,697 |
PROFIT AND LOSS STATEMENT 2022
In thousands of euros
| 2022 | 2021 | |
|---|---|---|
| Net turnover | 1,024.531 | 952,830 |
| Raw materials and consumables | (1,008.868) | (935,909) |
| Personnel expenses | (8,311) | (7,419) |
| Other operating expenses | (4,706) | (4,664) |
| Amortization of fixed assets | (528) | (461) |
| OPERATING RESULT | 2,118 | 4,377 |
| Revenue | 375 | 228 |
| FINANCIAL RESULTS | 102 | 16 |
| PRE-TAX RESULT | 2,220 | 4,393 |
| RESULT FOR THE YEAR | 1,641 | 3,325 |
STATEMENT OF CHANGES IN EQUITY FOR 2022 FY
Statement of recognised income and expense
In thousands of euros
| 2022 | 2021 | |
|---|---|---|
| Result of the profit and loss statement | 1,641 | 3,325 |
| Total revenue and expenses charged directly to the equity | - | - |
| Total transfers to the profit and loss statement | - | - |
| TOTAL RECOGNISED REVENUE AND EXPENSES | 1,641 | 3,325 |
STATEMENT OF CHANGES IN TOTAL EQUITY
In thousands of euros
| Capital | Legal reserve |
Statutory reserve |
Other reserves |
Group shares |
Result for the year |
TOTAL | |
|---|---|---|---|---|---|---|---|
| BALANCE AT START OF 2021 FY | 1,849 | 370 | 4,061 | 26,539 | (1,591) | 3,267 | 34,495 |
| Total recognised revenue and expenses | - | - | - | - | - | 3,325 | 3,325 |
| Operations with shareholders | |||||||
| BALANCE AT END OF 2021 FY | 1,849 | 370 | 4,061 | 28,526 | (1,591) | 3,325 | 36,540 |
| Total recognised revenue and expenses | - | - | - | - | - | 1,641 | 1,641 |
| Operations with shareholders | - | - | - | - | (944) | - | (944) |
| BALANCE AT END OF 2022 FY | 1,849 | 370 | 4,061 | 30,528 | (2,535) | 1,641 | 35,914 |
STATEMENT OF CASH FLOWS FOR 2022 FY
In thousands of euros
| 2022 | 2021 | |
|---|---|---|
| STATEMENT OF CASH FLOWS | (43,885) | (22,413) |
| Result for the year before taxes | 2,220 | 4,393 |
| Adjusted results | 976 | 573 |
| Changes in current capital | (46,047) | (26,290) |
| Other cash flows from operating activities | (1,034) | (1,089) |
| CASH FLOWS FROM INVESTMENT ACTIVITIES | (492) | (588) |
| Payments for investments | (495) | (589) |
| CASH FLOWS FROM FINANCING ACTIVITIES | (12.186) | (7.008) |
| Proceeds and payments for equity instruments | (944) | - |
| Acquisition of own equity instruments | (944) | - |
| Collections and payments for financial liability instruments | 14,453 | (5,728.01) |
| Other debt emissions | 14,553 | (5,528) |
| Repayment and amortisation of bank debt | (100) | (200) |
| Dividend payments and remunerations of other equity instruments | (1,323) | (1,280) |
| Dividends | (1,323) | (1,280) |
| NET INCREASE/DECREASE OF CASH OR CASH EQUIVALENTS | 32,191 | 30,009 |
| Cash or cash equivalents at start of period | 32,281 | 62,290 |
| Cash or cash equivalents at end of period | 90 | 32,281 |